In this second part, I will show another metric used in video quality evaluation: the Structural SIMilarity Index (SSIM). In the previuos article, we saw that PSNR and MSE are not always reliable in every situation, so we need a more accurate metric that’s able to cover a wider spectrum of distorsions and losses in video information.
Why SSIM?
Images are highly structured, so in order to evaluate the quality of a copy you need to measure not only the variations of pixels value than the reference sample, but also the structural distorsions introduced. The first step therefore is to distinguish the structures in a scene. The luminance of the surface of an object is the product of illumination and the reflectance, but its structure is independent of the illumination, so the structural information of an image is defined as the set of attributes that form the structure of the objects represented in the scene, regardless of the average luminance and contrast. Since these two characteristics may vary within the scene, they have to be considered in a local way.
How it works
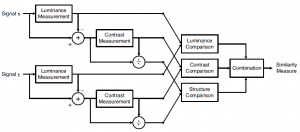
Let X and Y two NxM arrays representing the (Y) luminance channel of the frames to evaluate; X represents the reference copy, while Y the lossy/distorted sample. Let x and y their monodimensional versions, obtained by merging together the columns (or the rows) of the bidimensional arrays. This is a useful step in order to eliminate a summation in formulas and to write a cleaner code in numerical softwares, but doesn’t affect the generality of this treatment. Let N = NxM for simplicity.
So, the first step is to measure the luminance of x and y, which is understood as the the average of their values, here respectively indicated as μx and μy:

 Then, the function for the comparison of the luminance, l(x,y), is defined as follows:

Where C1 = (K1L)2, with K1 is an arbitrary constant (<< 1) usually set to 0.01 and L is equal to the maximum possible pixel value of the image (or, more specifically, of the luminance channel); so, if are used 8 bits per sample, L = 28-1 = 255.
Next, luminance’s information is removed by calculating the standard deviations of the two images (respectively indicated as σx and σy), in order to obtain their average contrast:
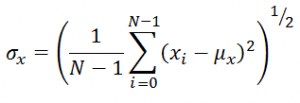
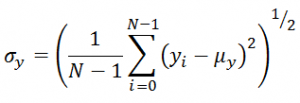
And now, the contrasts are compared by using the following function:
 As you could expect, C2 is a constant usually equal to (K2L)2, with K2 << 1 and usually set to 0.03.
The third piece of the puzzle is the structure comparison function s(x,y), that remembers Pearson’s correlation index between two signals:

With C3 = C2/2, and
Finally, here is the SSIM Index:
![]()
The exponents α, β and γ, greater than zero, are parameters used to calibrate the weight of the three functions in the measurement; typically, α = β = γ = 1, so the SSIM Index can be rewritten as follows:

As the index of structural similarity approaches 1, the greater the degree of fidelity of the encoded copy is close to the original.
In evaluating the quality of the images, however, the given SSIM Index is not applied directly to the entire image: it’s preferred to work locally because the characteristics of a scene are space-varying. Therefore a circular symmetric Gaussian window of size 11×11 and standard deviation of 1.5 is introduced, that moves the entire image pixel by pixel, producing a function with appropriate weights, changing the parameters of brightness, contrast, and covariance as follows:
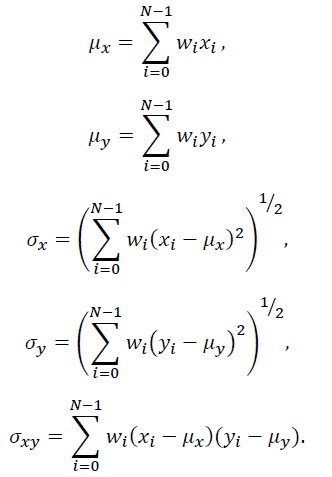 Let M the number of windows applied to the frames: M previously defined SSIM Indexes are generated, and it’s possible to define a new index (usually called MSSIM) by averaging the M measures:
 The adoption of this last version of SSIM Index is widespread.
Matlab code
A great Matlab implementation can be downloaded directly from the web page of the “fathers” of this metric: https://ece.uwaterloo.ca/~z70wang/research/ssim/.
Example
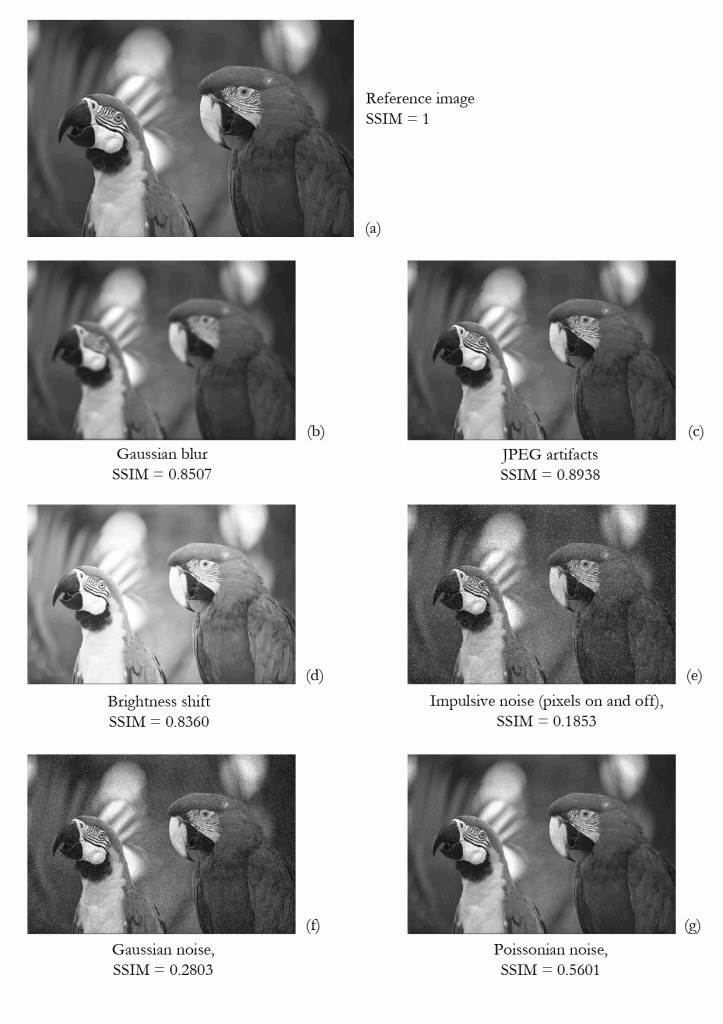
Take a look to (d): it shows a good SSIM Index, but – if you remember Part 1 – it has a very low PSNR (12.95 dB); this is one of the many reasons that makes SSIM more reliable than PSNR in a wide spectrum of situations.
Read more and external sources
- MSE, PSNR and the need of a new index (SSIM):
Mean Squared Error: love it or leave it? A new look at Signal Fidelity Measures. Wang Zhou, A.C. Bovik. Signal Processing Magazine IEEE. Volume: 26, Issue: 1. Publication Year: 2009, Page(s): 98 – 117. - Kodak lossless true color image suite.
- Xiph.org test media.